Analyze the performance of a flow
The analysis of a flow’s performance is essential to understand at which stages users drop off, fail, or experience friction within a process. Flow Metrics facilitates this understanding by displaying key metrics directly over the flow diagram, allowing quick and visual identification of bottlenecks and optimization opportunities.
How to use it
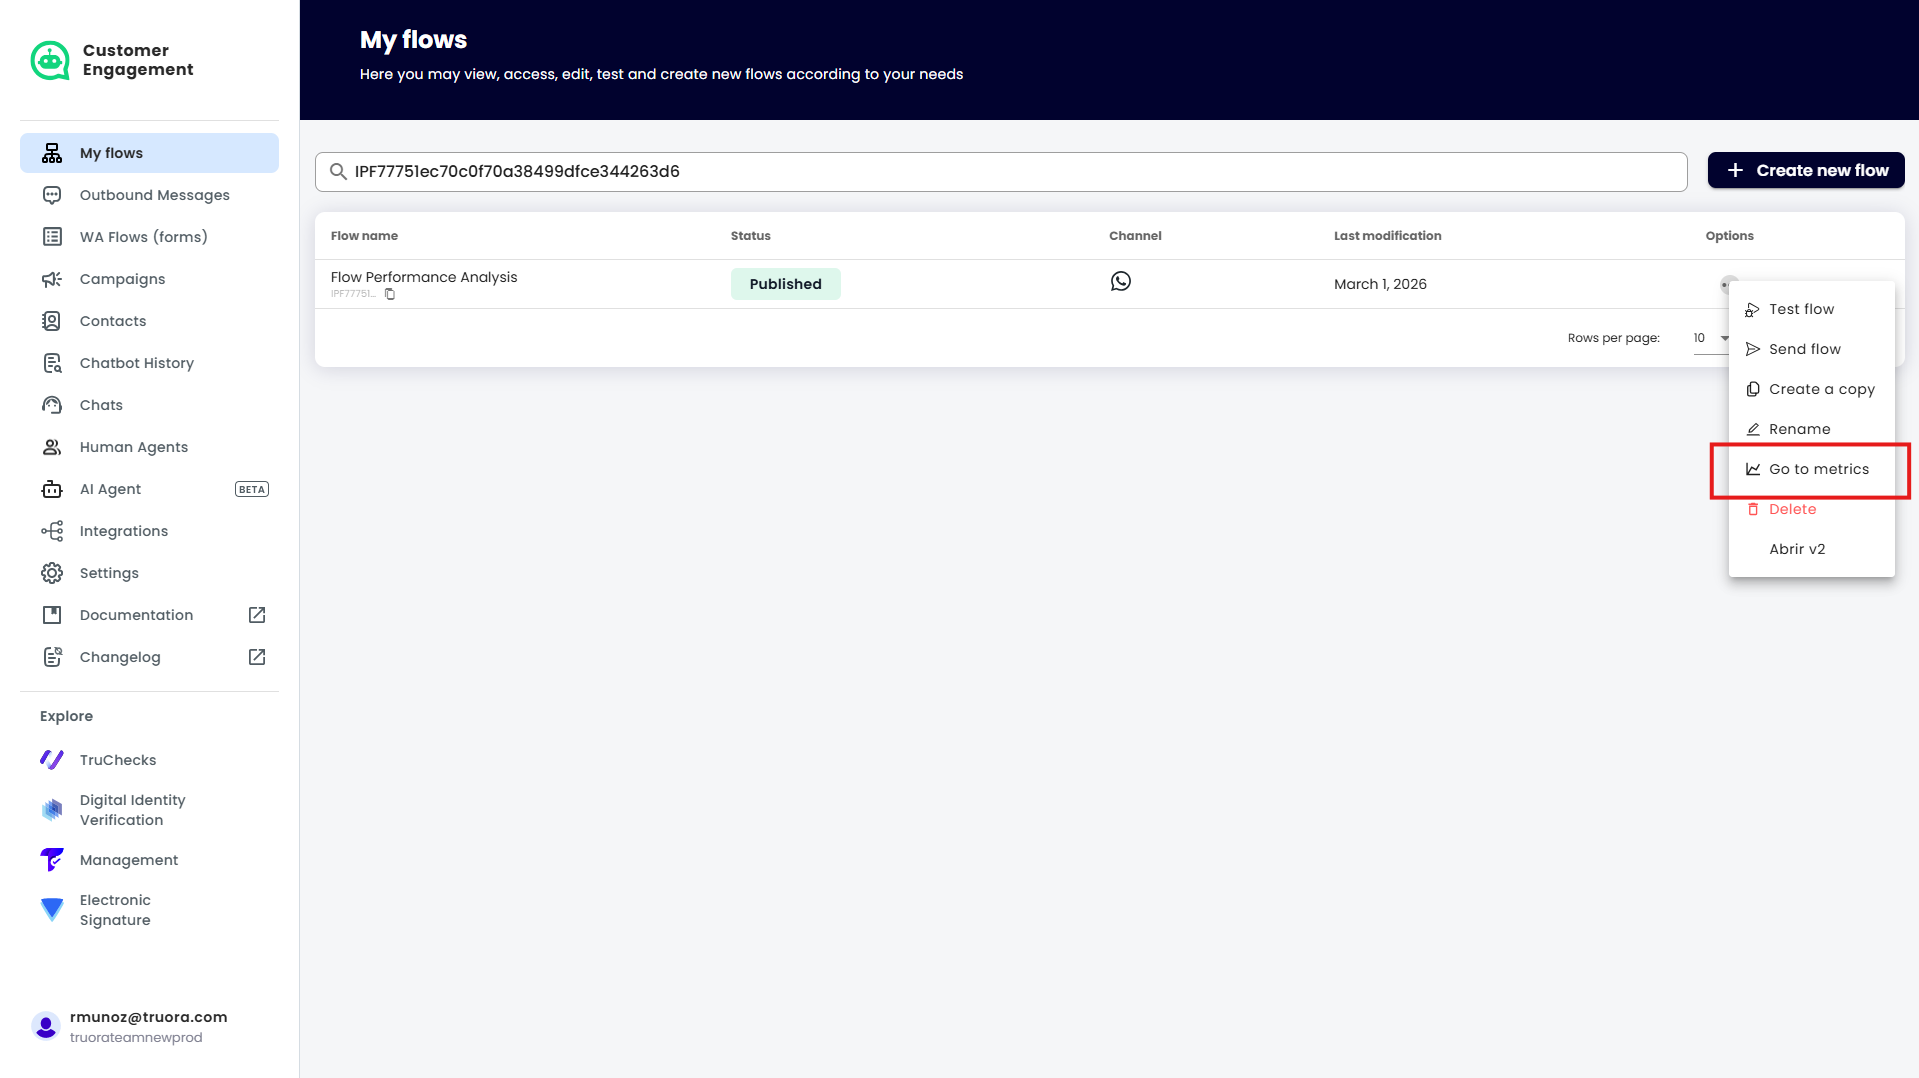
- Access the list of flows and select the “Go to metrics” option on the flow you wish to analyze.
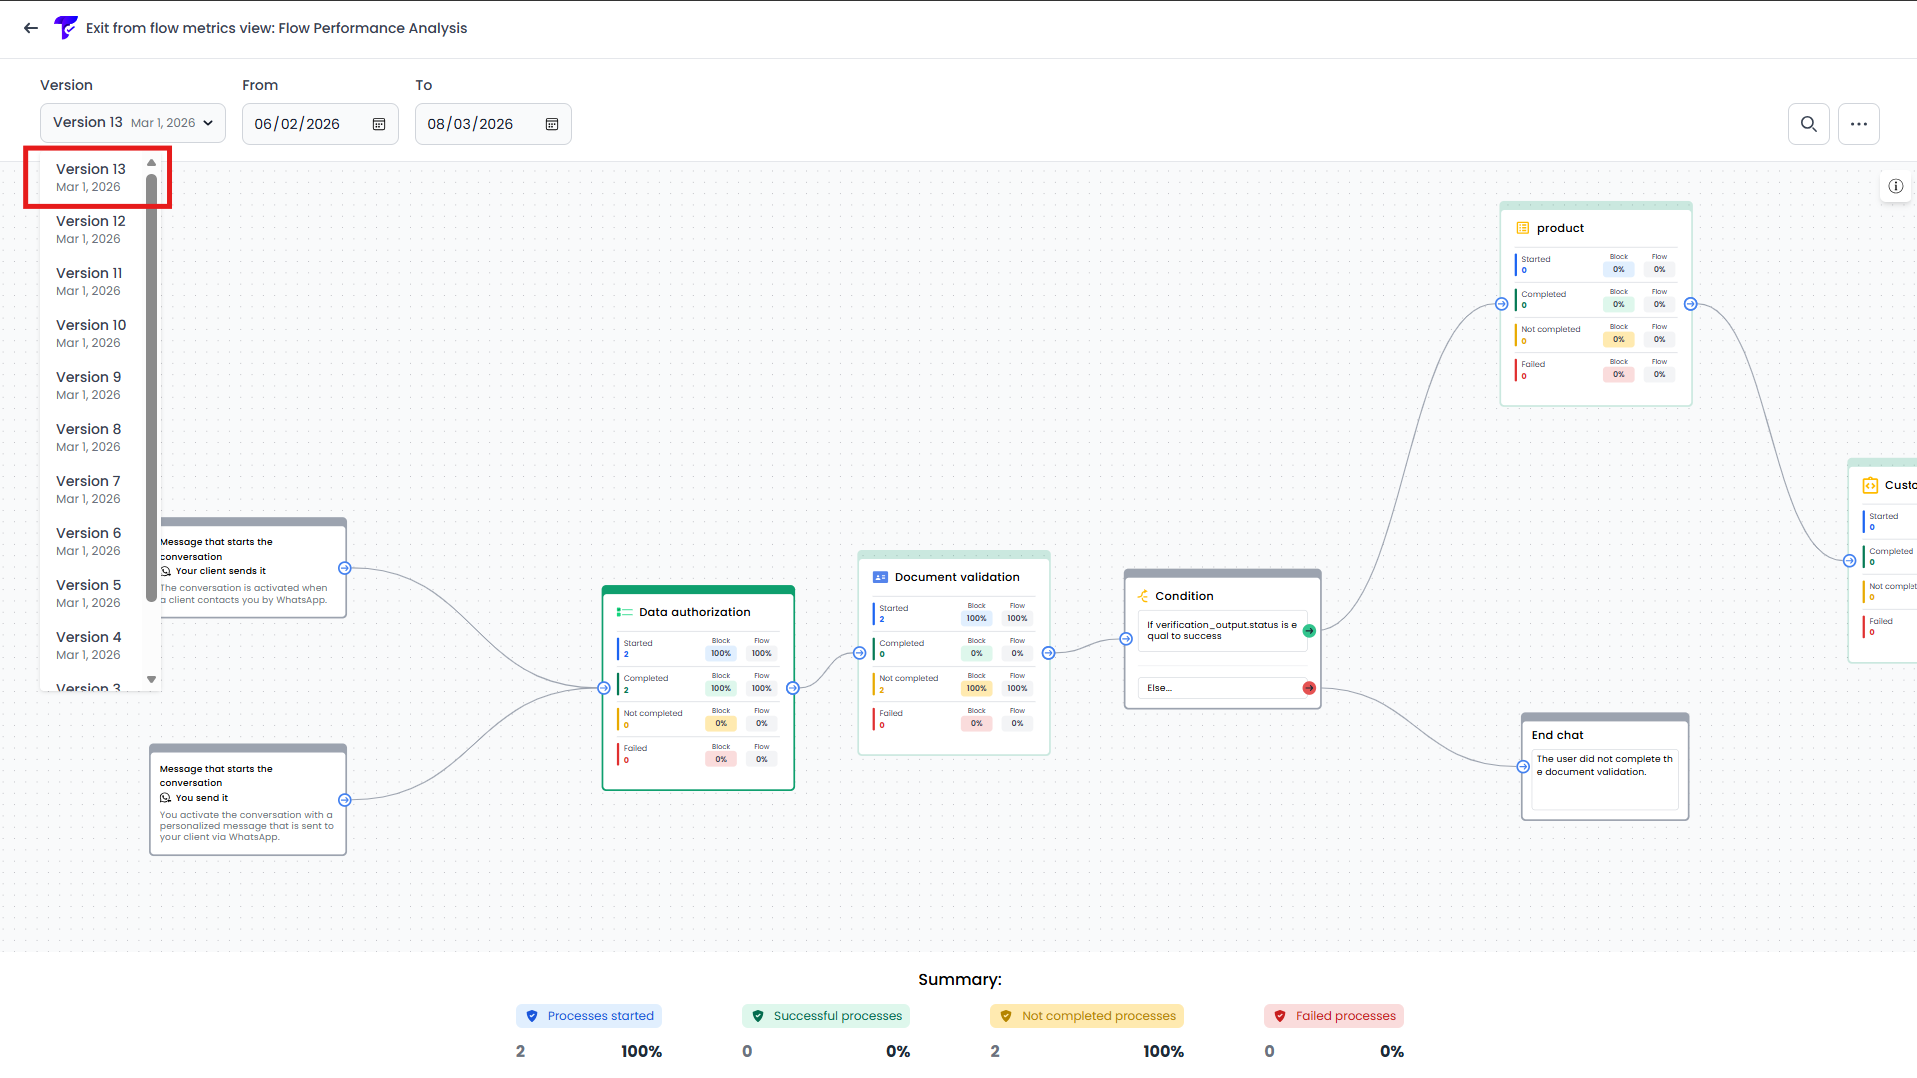
- Select the flow version you want to evaluate (the most recent version will be selected by default), ensuring that the displayed metrics correspond to the correct structure.
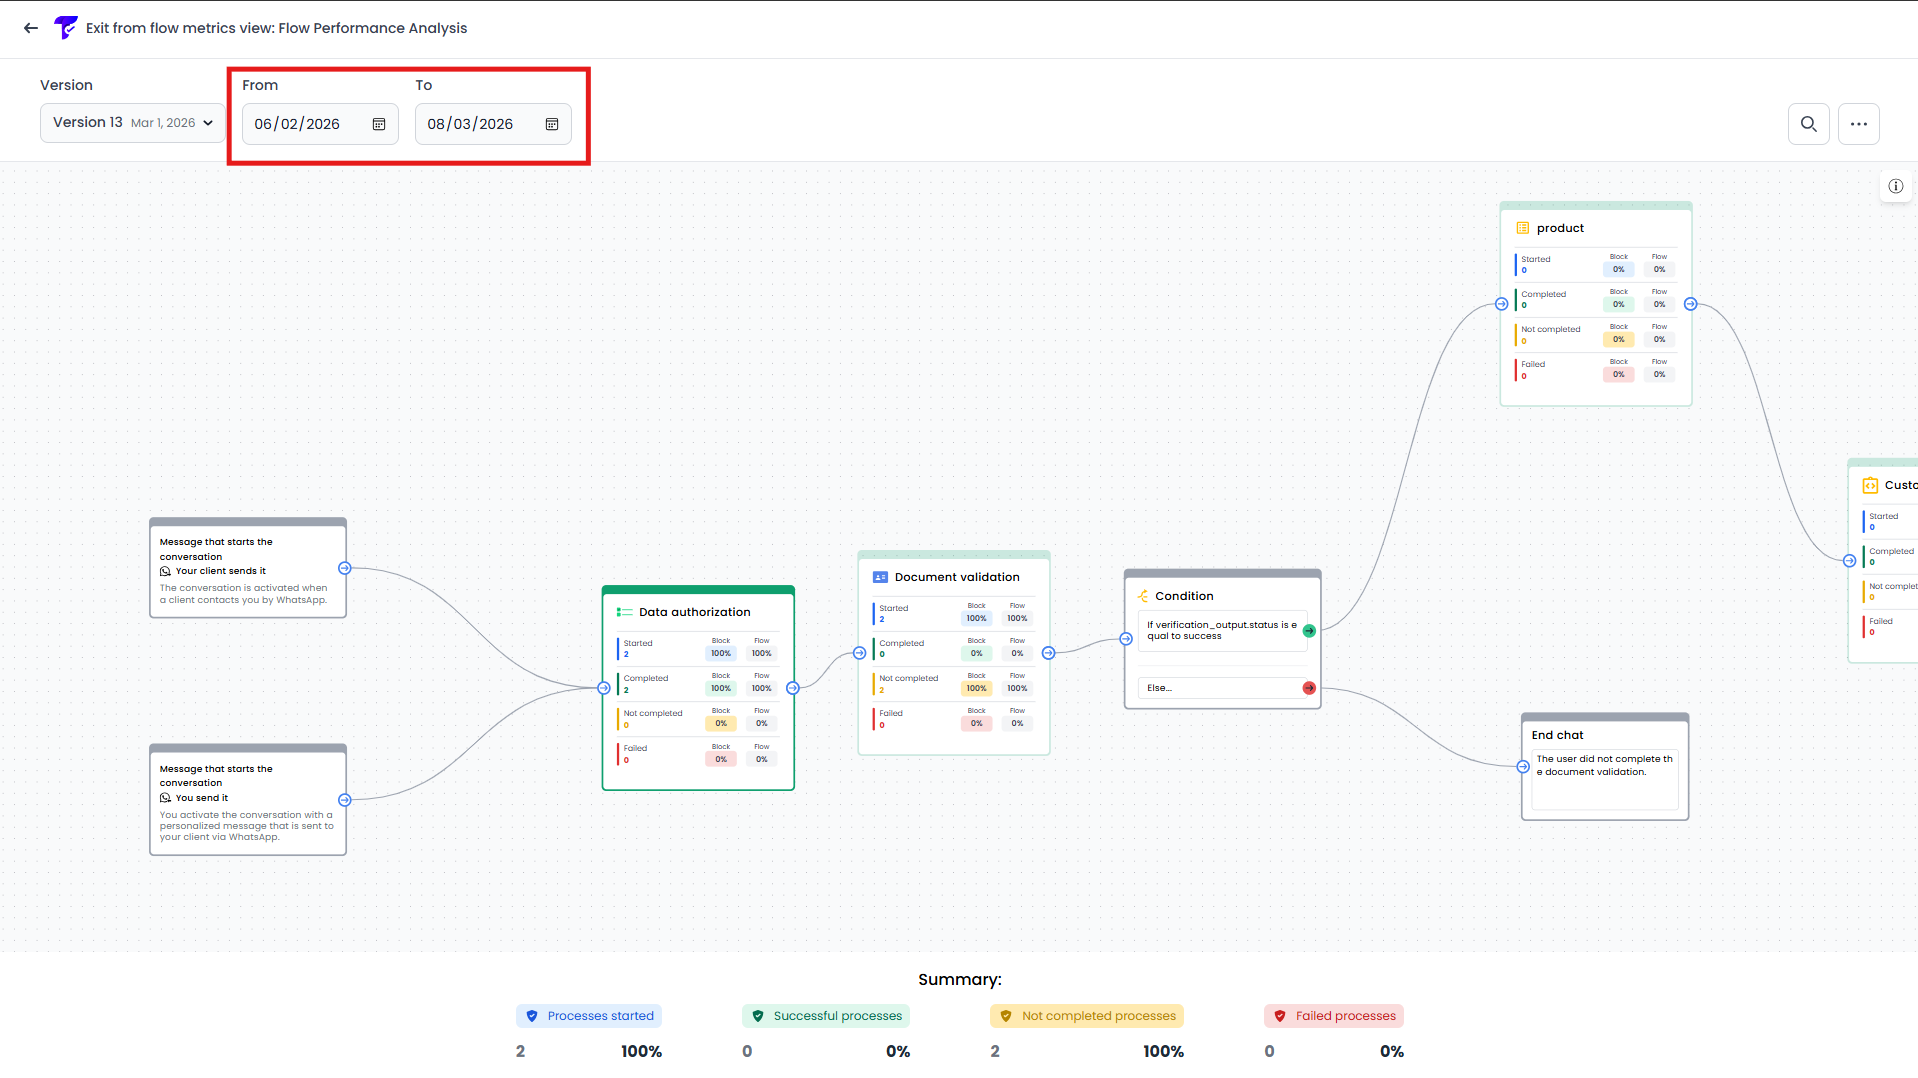
- Define the date range for the analysis; by default, the last eight days will be selected.
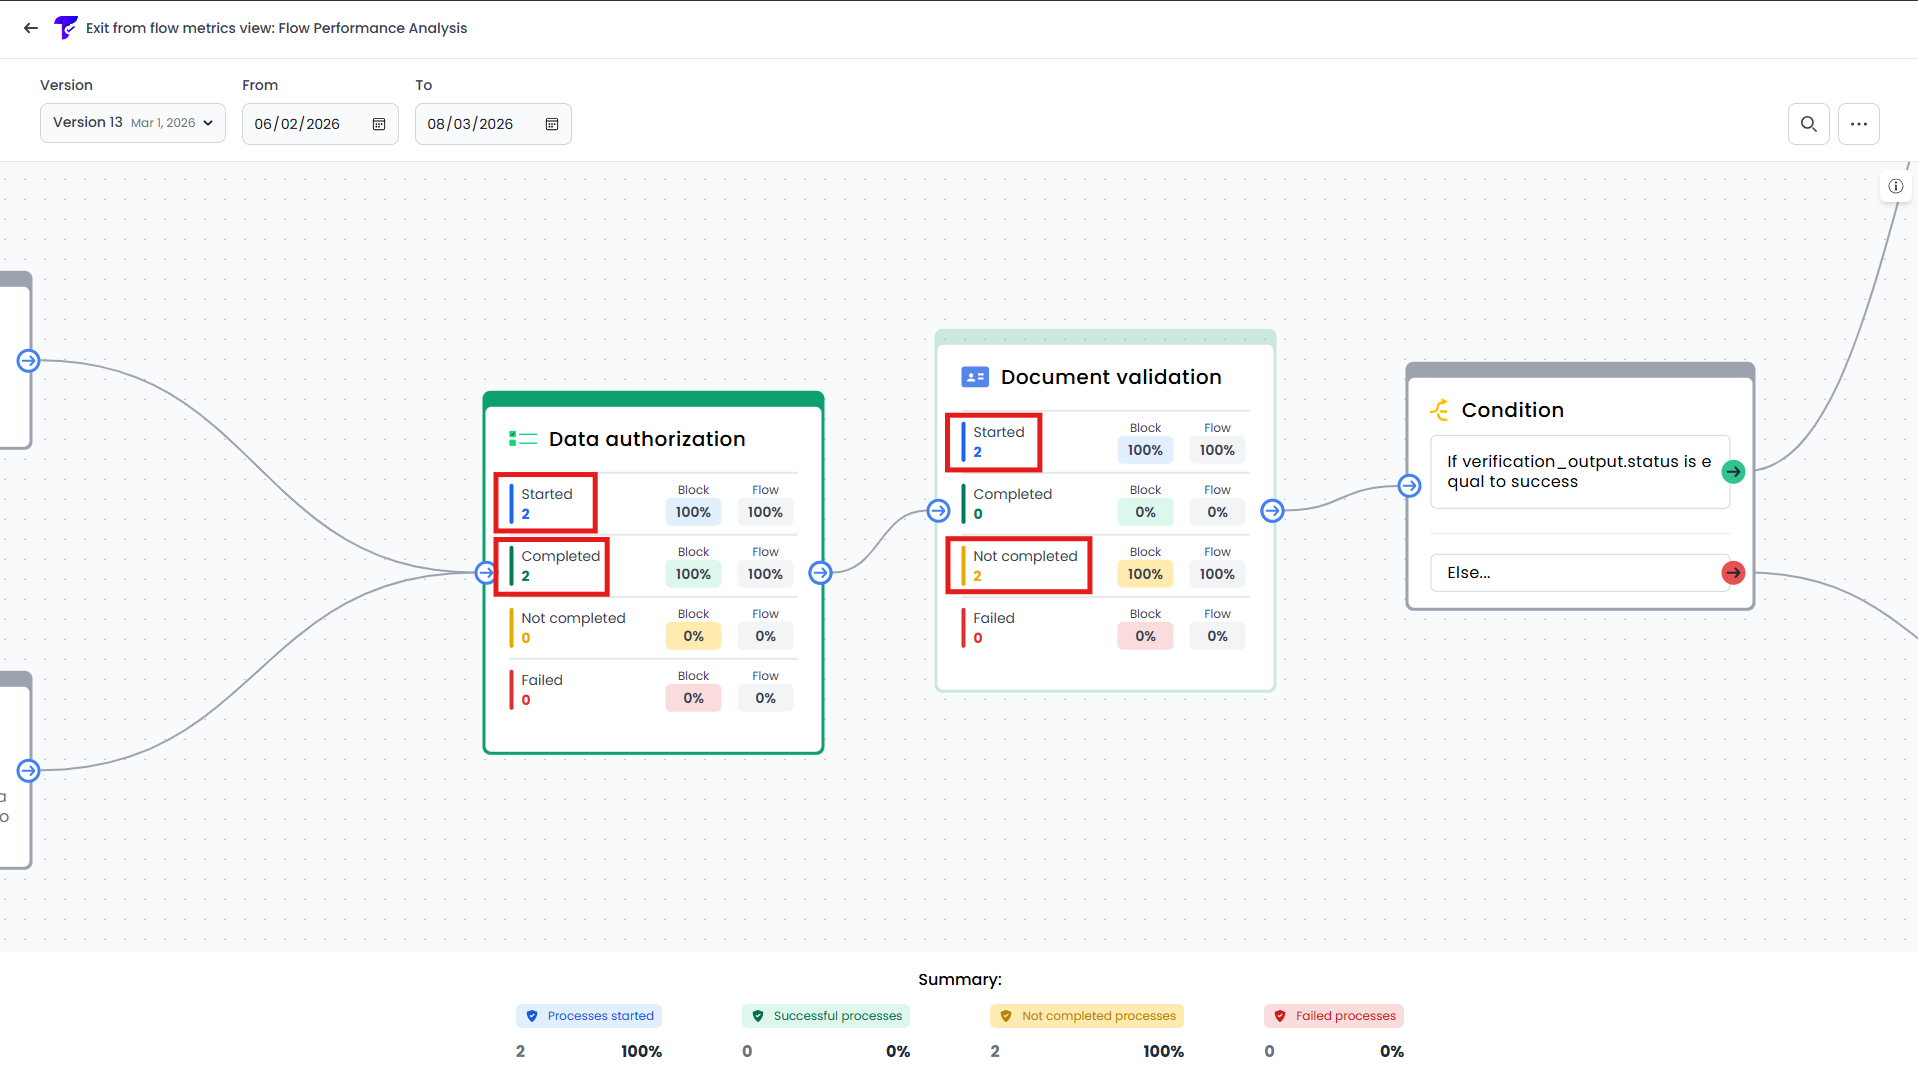
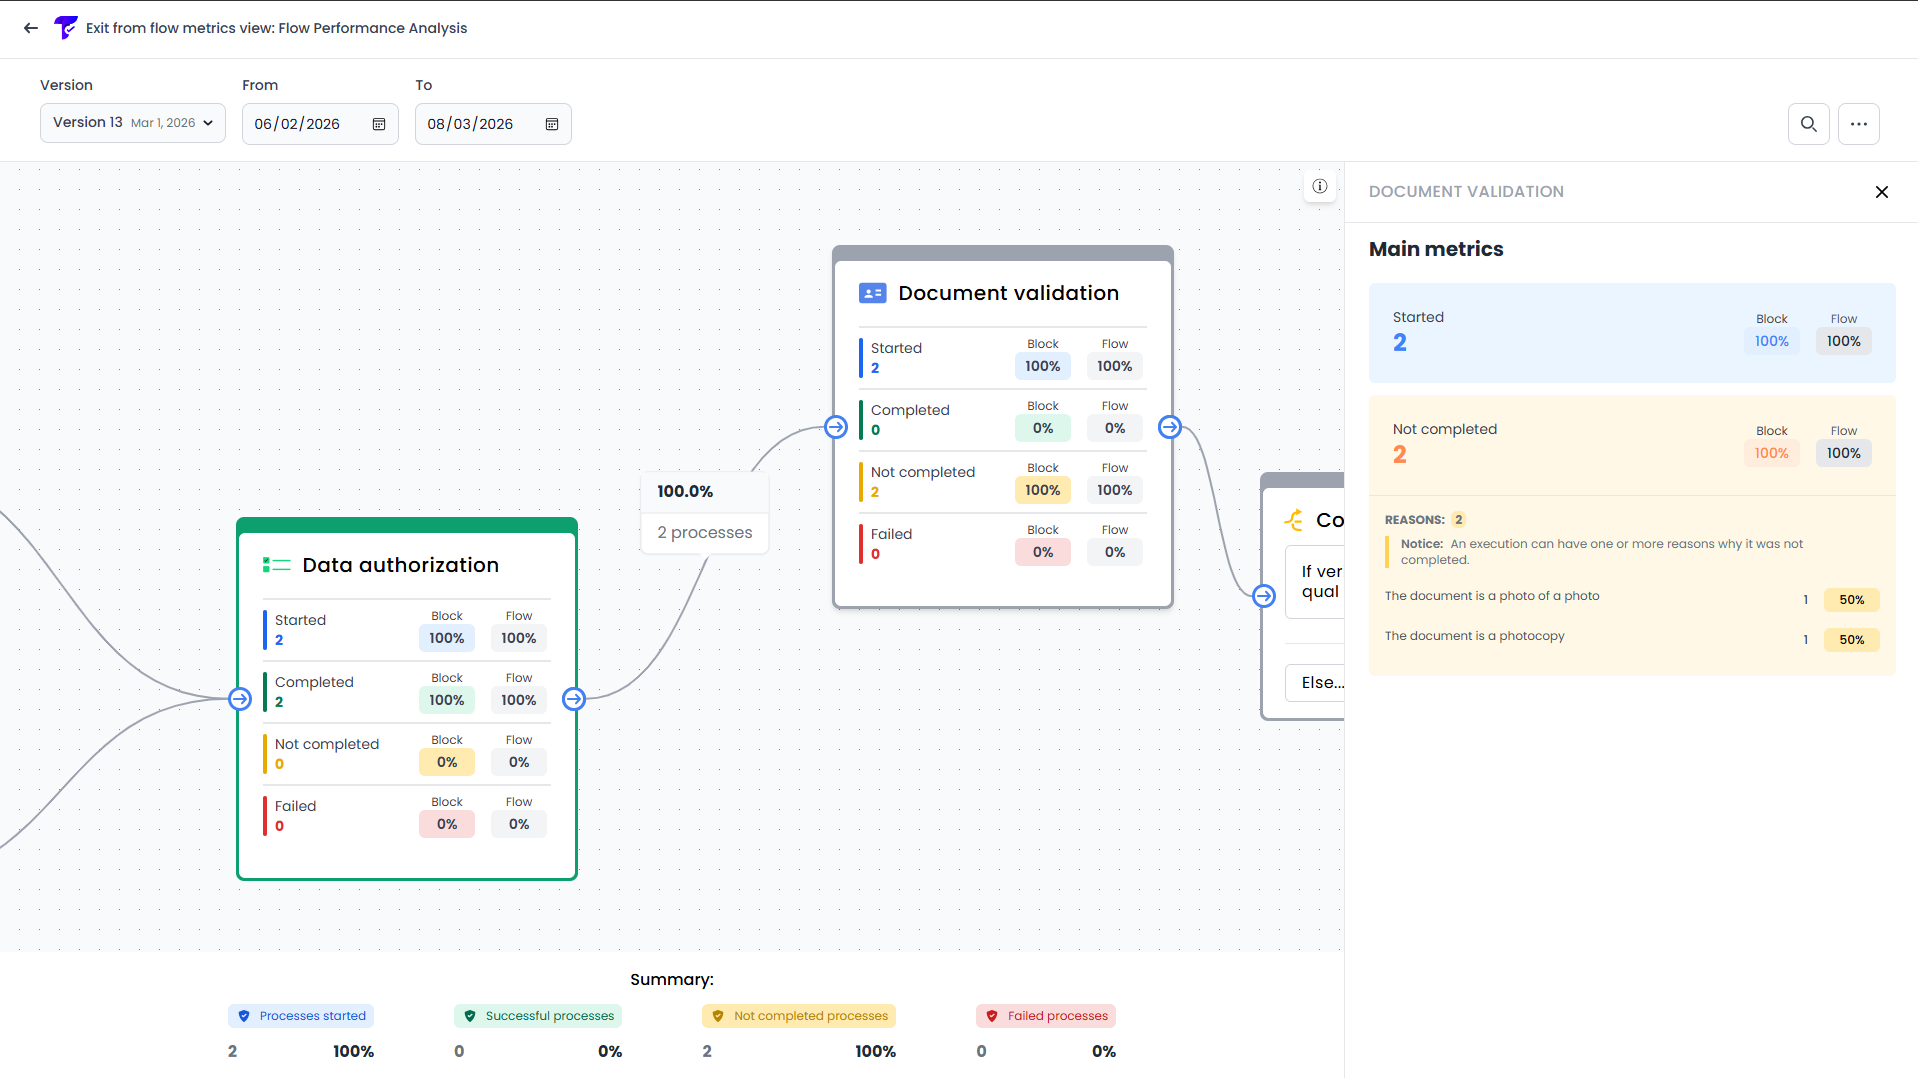
- Once the diagram has loaded, each block will display key metrics such as the number of initiated executions, success rates, failures, and conversions. These metrics help identify:
- Executions that started the verification process.
- Executions successfully completed.
- Executions not completed by the user.
- Executions that failed.
- Conversion rate between stages.
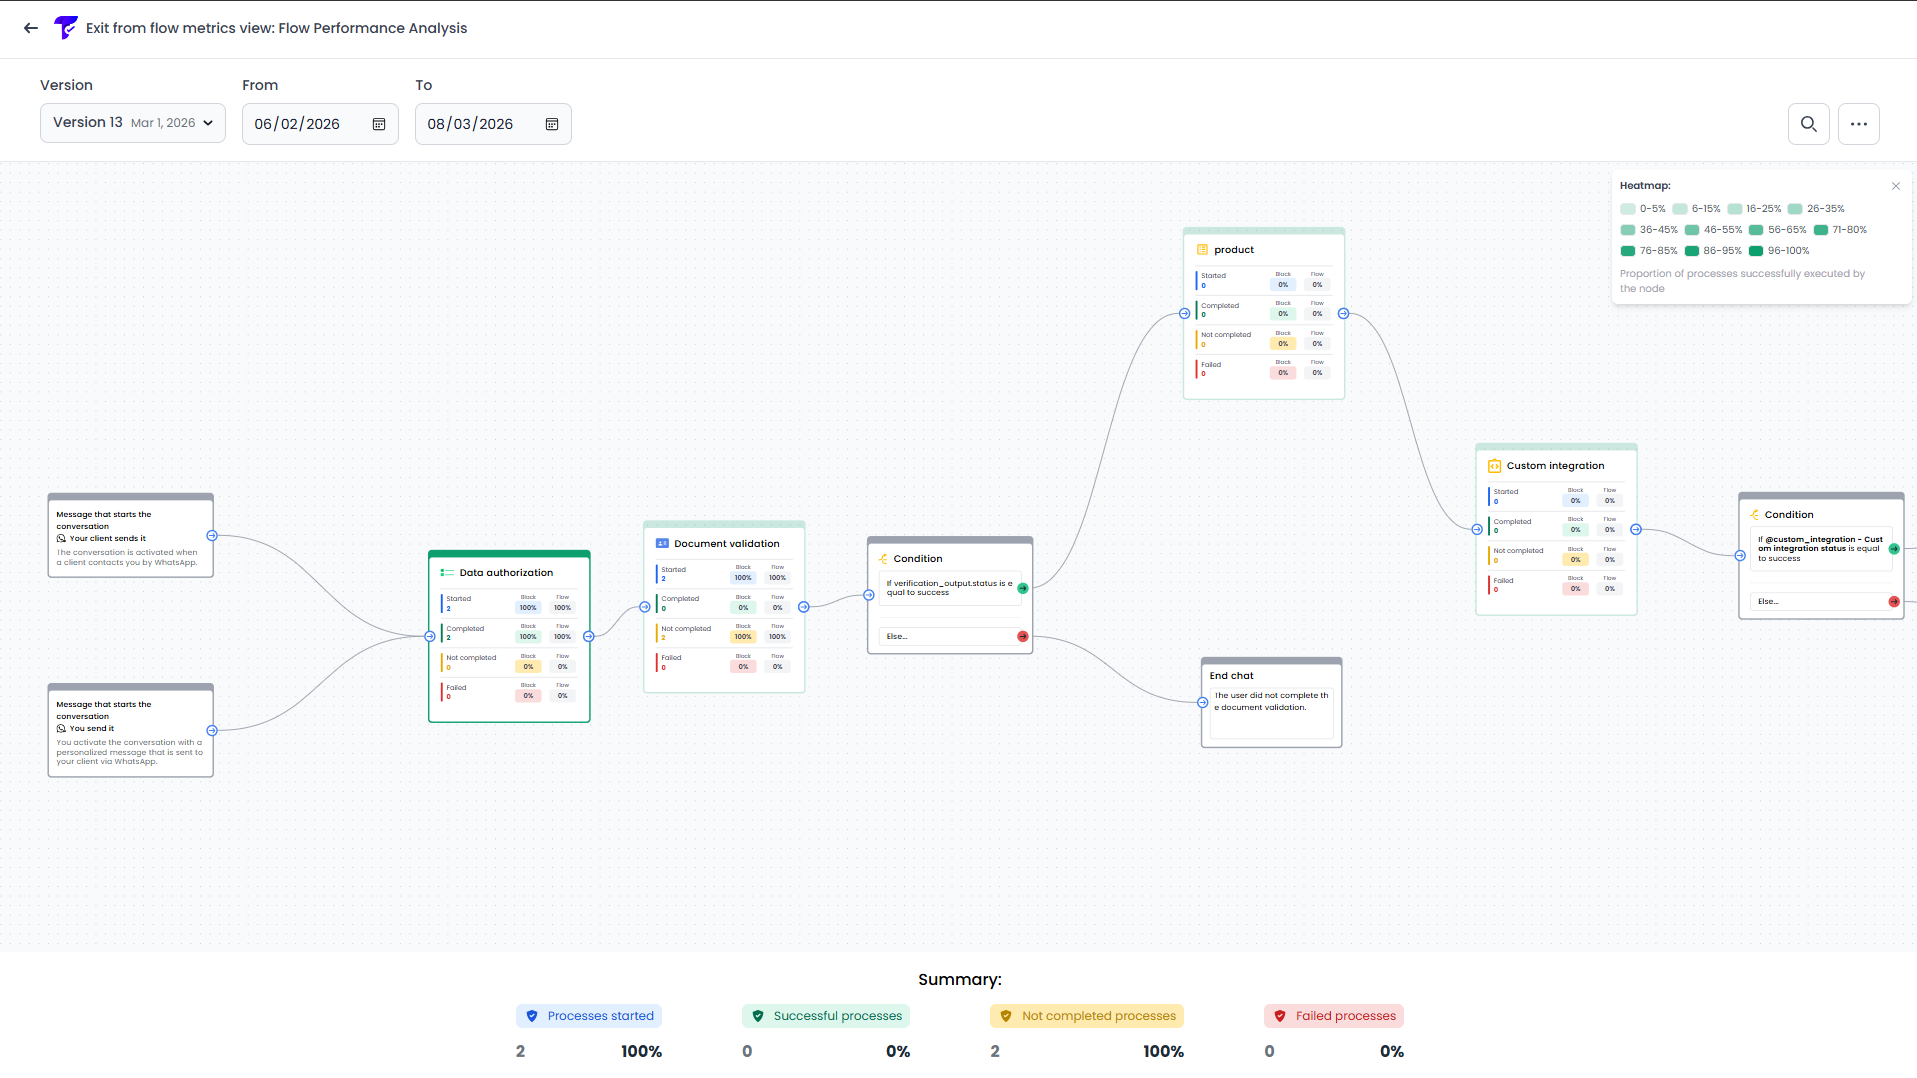
- Navigate through the flow using the zoom and pan tools to identify blocks with lower performance or higher drop-off rates.

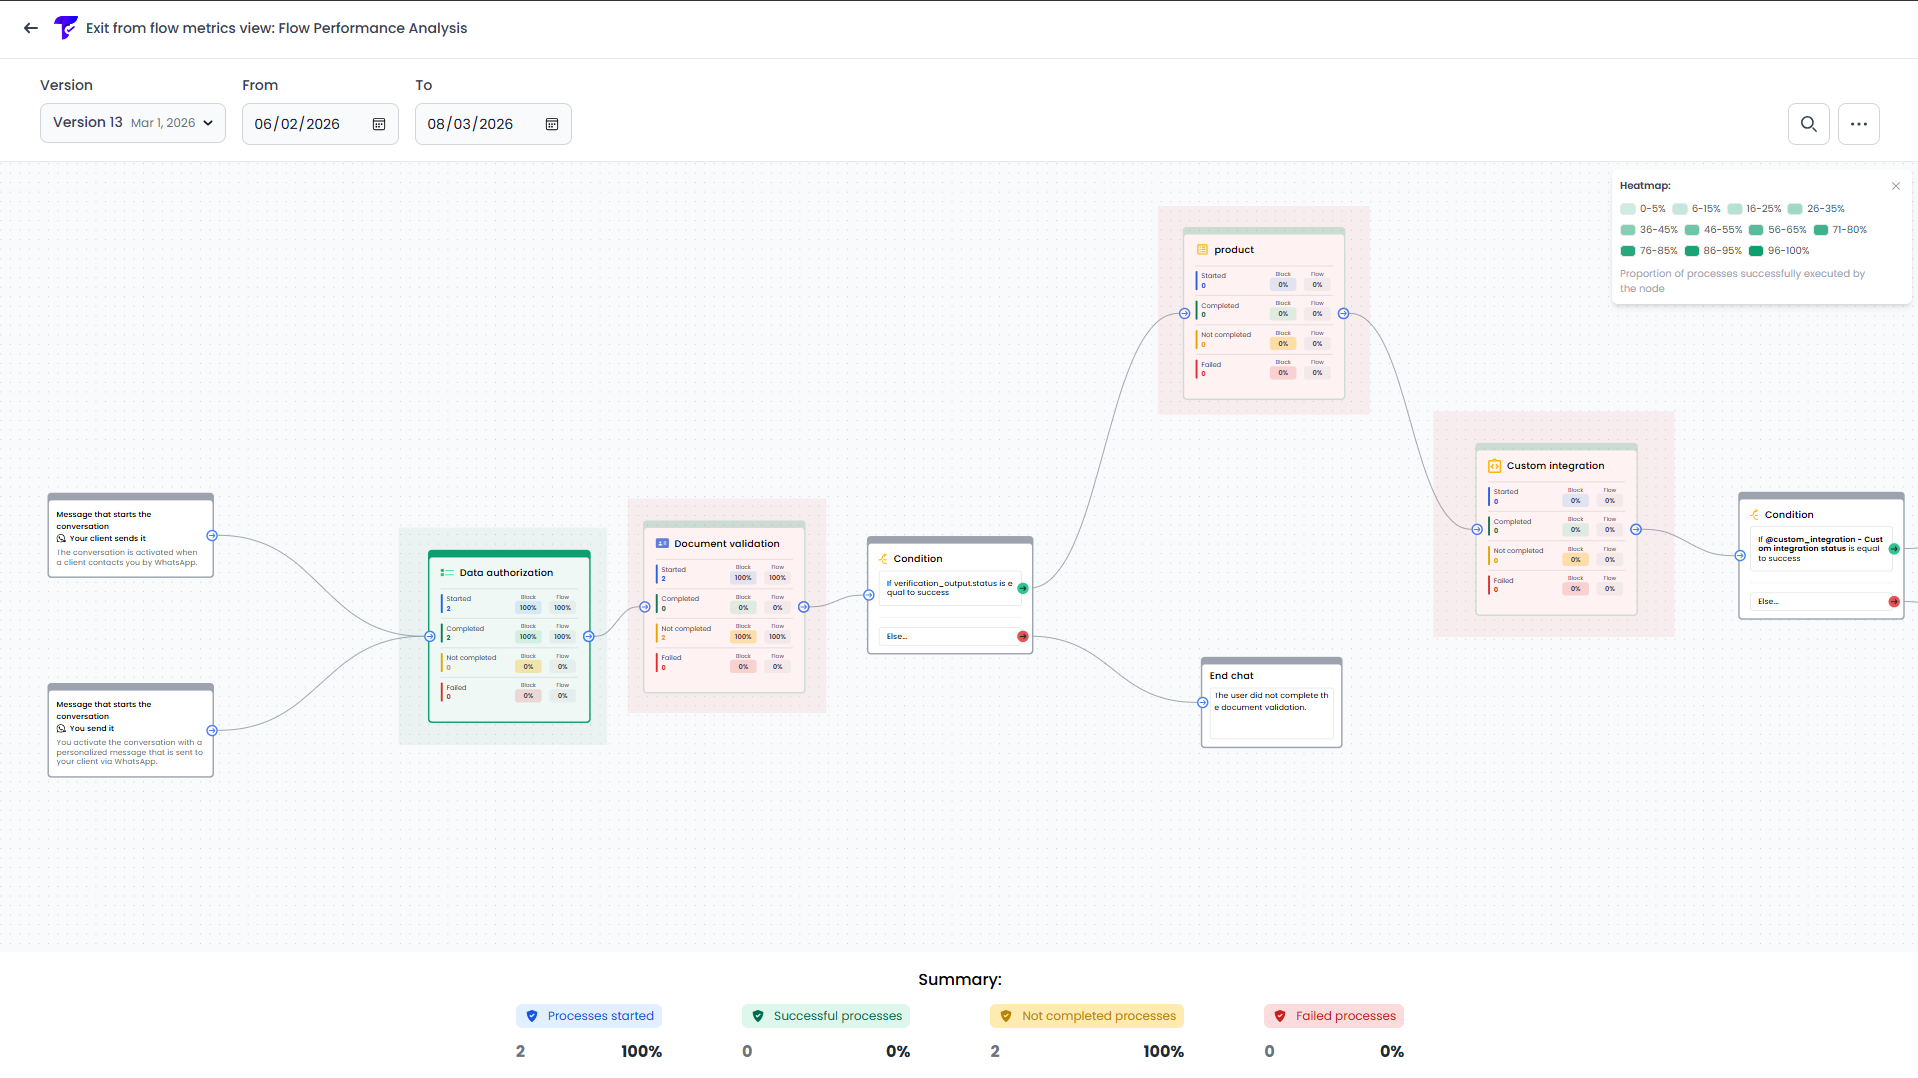
- Additionally, the flow highlights blocks with varying color intensities (heatmap style) to help you quickly identify those with higher or lower execution volumes.
- Use the node search to quickly locate specific blocks in large flows. Type the name or identifier of the node in the search box to highlight and focus on it in the diagram, making it easier to find and analyze individual blocks.
- Click on a block to access the details panel, which provides specific information such as the reasons why certain executions were not completed. Additionally, the connections (edges) display labels with information about where executions come from and where they go.
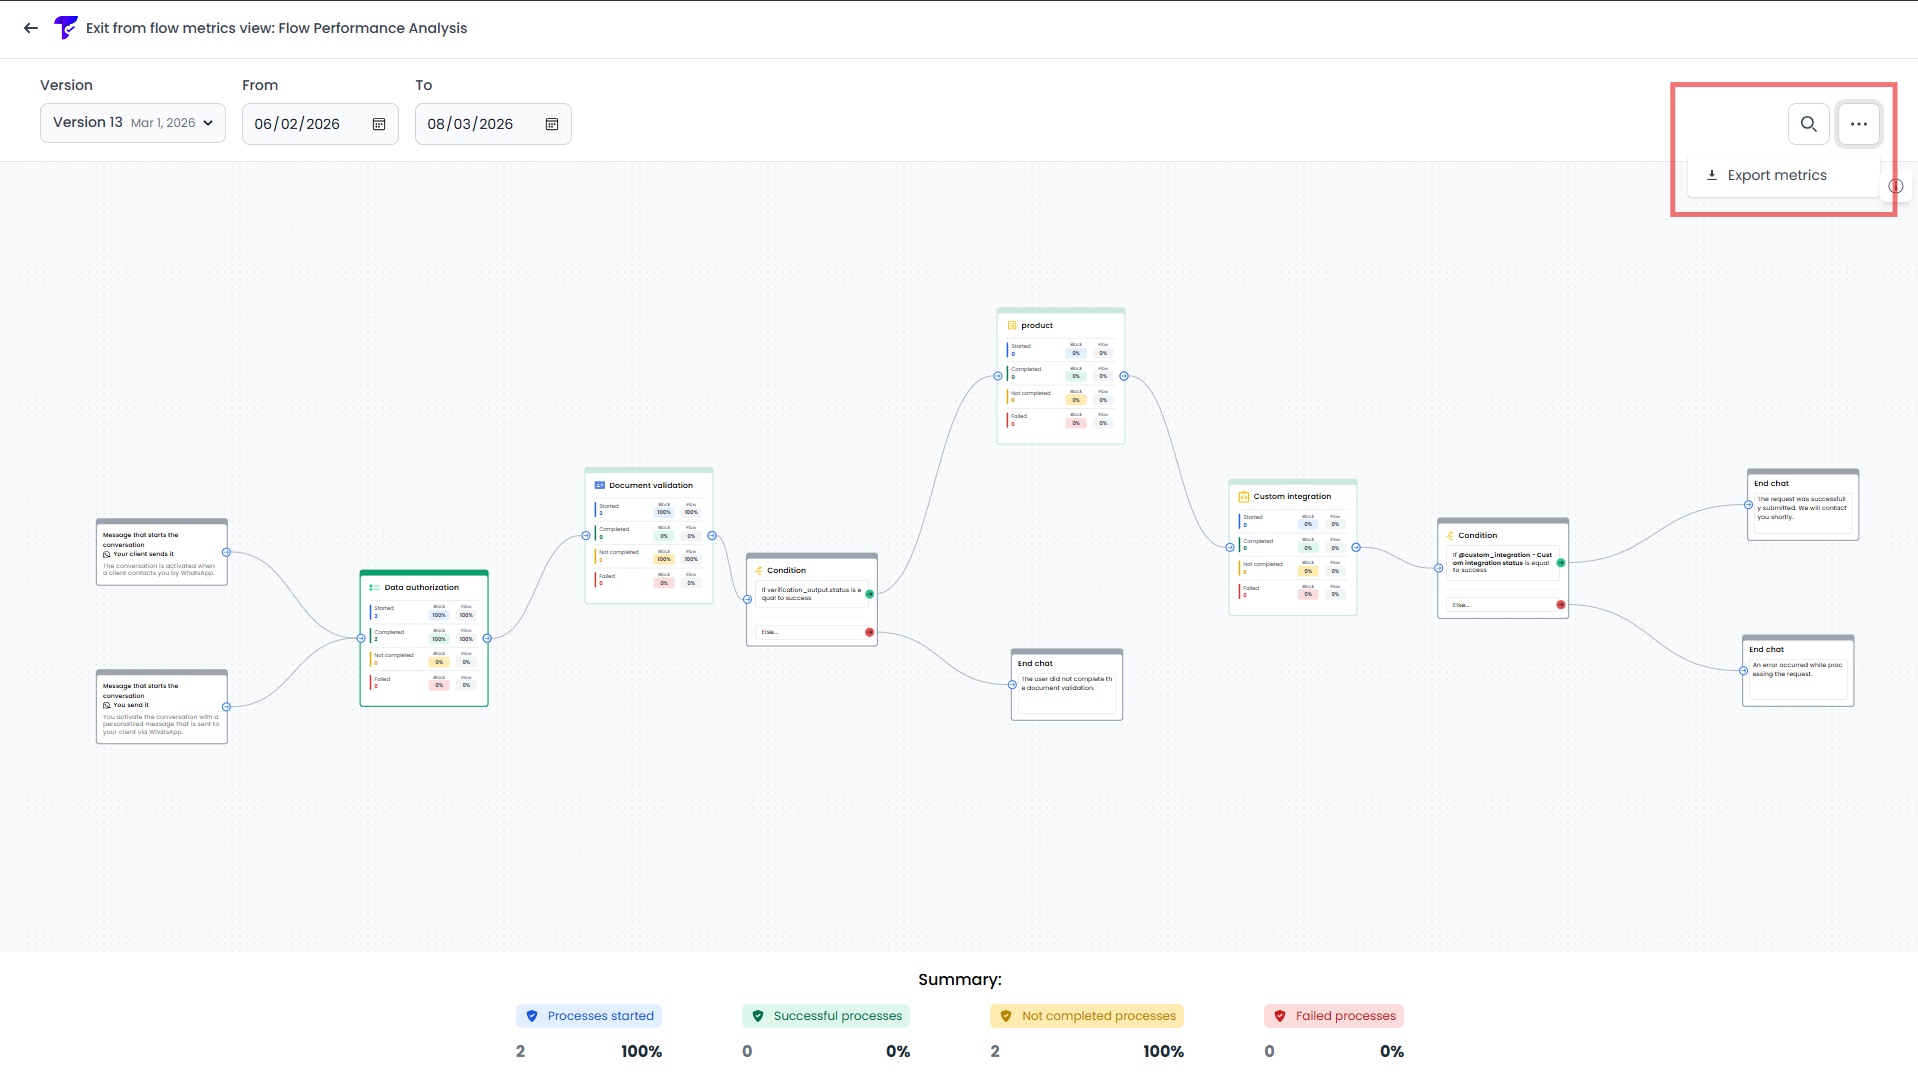
- Export the metrics data to download the analysis in a file (.CSV) for reporting or further processing outside the platform.