Flow execution view
The Flow execution view is a visual representation that shows how a specific process executed through your flow. This view displays the same flow structure as the flowbuilder, but highlights the actual path taken by the process, making it easy to understand which blocks were executed and in what order.
When you create a Web Flow or a WhatsApp Flow, the flowbuilder allows you to design the sequence of steps that users will follow. Once a user completes a process, the Flow execution view provides a detailed visualization of that specific execution.
Accessing the Flow execution view
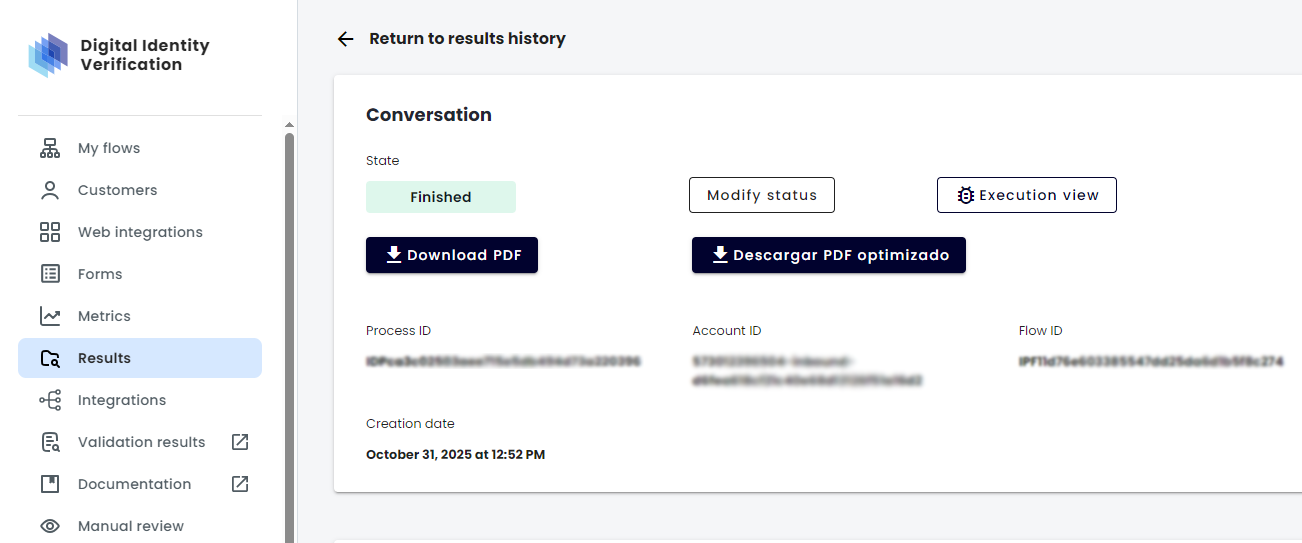
To access the Flow execution view for a specific process:
- In the Digital Identity dashboard, go to the Results tab in the side menu.
- At the top, ensure the Results tile is selected.
- Search for the process you want to review using the Search bar. You can search by Process ID, Flow ID, Account ID, Document Number, Phone number, or Name.
- Click on the process you want to view from the results list.
- In the process details view, look for the Execution view option or button to open the visual flow representation.
Note: For more information on how to search and access process results, please refer to the Guide to Get Results.
Understanding the Flow execution view
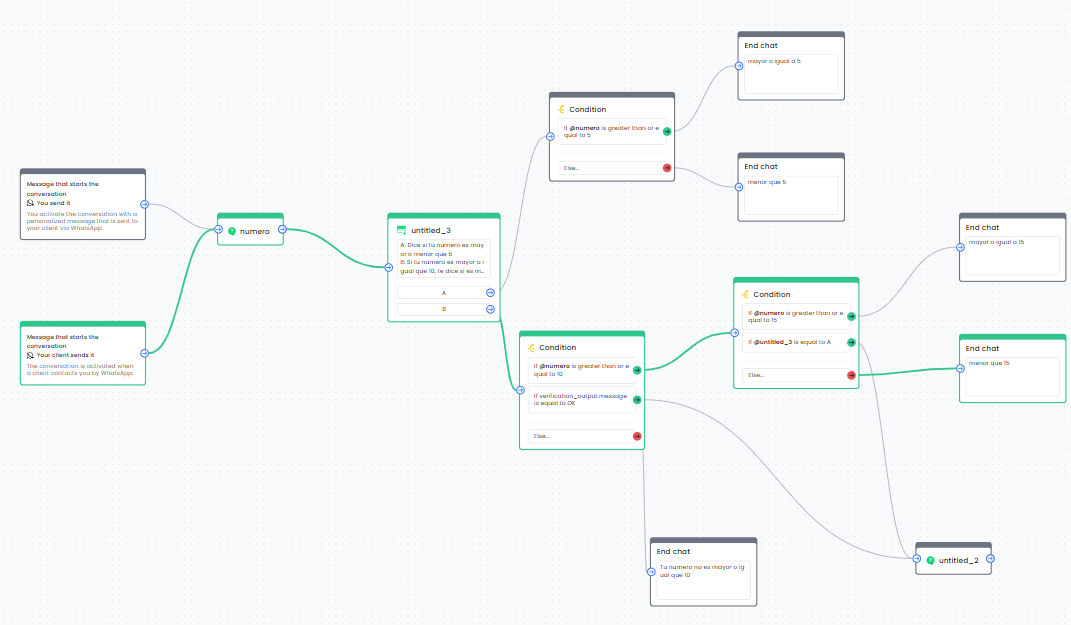
The Flow execution view displays all the blocks (verifications) and connections between them, just like your flowbuilder. However, this view provides additional visual information about the actual execution:
Visual path highlighting
The Flow execution view uses color coding to show the execution path:
- Executed blocks: Blocks that were successfully executed during the process are highlighted or colored to indicate they were part of the execution path.
- Executed connections: The connections (lines) between executed blocks are also highlighted, showing the exact sequence followed.
- Non-executed blocks: Blocks that were not reached during this specific process execution remain in their default state, allowing you to see the complete flow structure while clearly identifying which parts were actually used.
This visual representation helps you:
- Understand which validation steps were completed
- Identify where the process might have failed or stopped
- See alternative paths that were not taken
Interacting with blocks
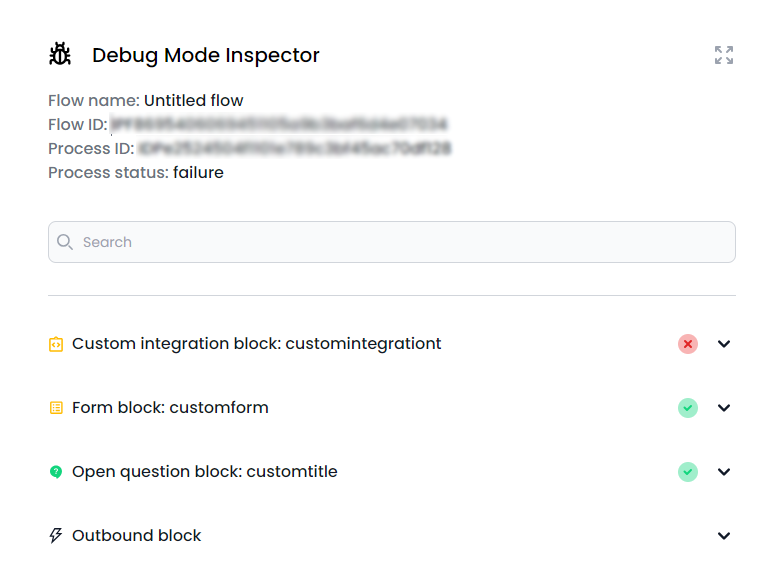
The Flow execution view includes a sidebar on the right side of the screen that is always visible. This sidebar displays a list of all executed blocks in the process, organized in an accordion format.
Block information sidebar
Each block is displayed as an accordion item that you can expand or collapse to view its details. The sidebar shows different types of information depending on the block type:
Clicking on blocks in the flow
When you click on a block in the flow visualization:
- The view automatically scrolls to bring the selected block into view
- The corresponding accordion item in the sidebar automatically expands to show that block’s information
This allows you to quickly navigate between the visual flow representation and the detailed block information.
Clicking on accordion items in the sidebar
You can also interact directly with the sidebar by clicking on any accordion item:
- Clicking an accordion item expands or collapses it to show or hide the block’s details
- When you expand an accordion item, the corresponding block in the flow visualization is highlighted
- The view automatically scrolls to bring the highlighted block into view
This bidirectional interaction makes it easy to navigate between the visual flow and the detailed execution data.
General block information
For all blocks, when you expand the accordion item in the sidebar, it displays:
- Inputs: The data that was received or used as input for this block during execution.
- Outputs: The data that was generated or returned by this block after execution.
- Execution status: Whether the block executed successfully or failed
- Execution timestamp: When this block was executed during the process.
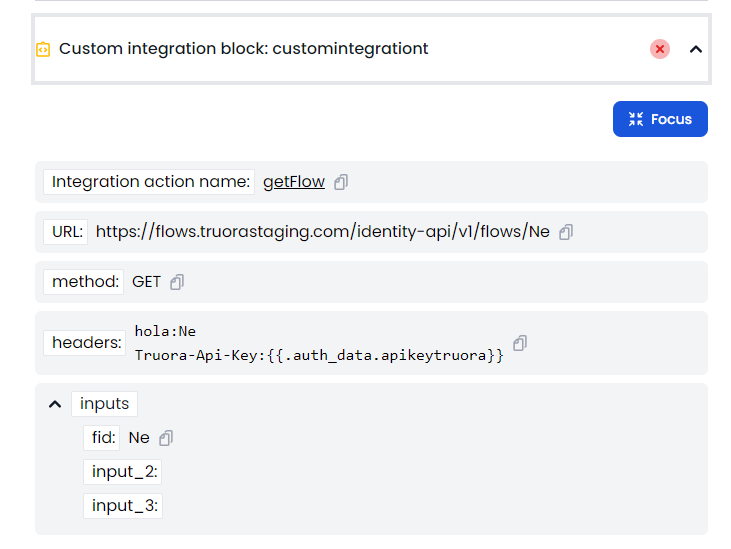
Custom integrations blocks
For Custom Integration blocks, when you expand the accordion item in the sidebar, it provides additional information about the HTTP request that was made:
- Request URL: The endpoint that was called.
- HTTP Method: The HTTP method used (GET, POST, PUT, DELETE, etc.).
- Request Headers: Headers sent with the request.
- Request Body: The payload sent in the request (if applicable).
- Response Status: The HTTP status code received.
- Response Body: The response data received from the integration.
Validation blocks
For Validation blocks (such as Document ID, Face Match, Email Validation, etc.), when you expand the accordion item in the sidebar, it shows:
- Validation details: Information specific to the validation type performed.
- Retry information:
- Number of retry attempts made
- Retry attempt details (if multiple attempts were made)
- Status of each retry attempt
- Reason for retries (if applicable)
- Validation status: The final outcome of the validation (success, failure).
- Validation inputs: The data provided for the validation (e.g., document images, face photos).
- Validation outputs: The results and details returned by the validation.
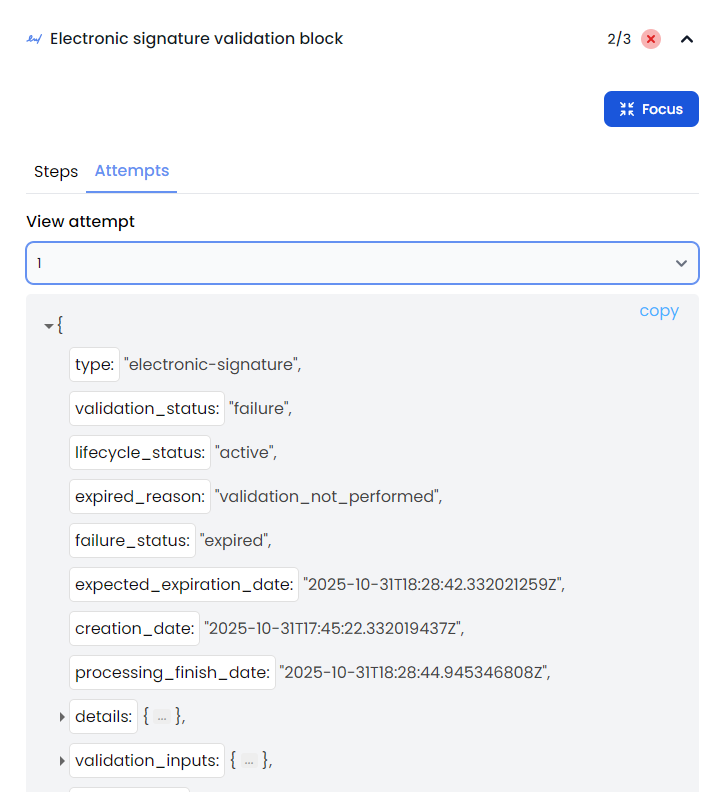
Note: The retry information is especially useful when a validation fails and the user attempts to retry. You can see each retry attempt, what changed between attempts, and why certain attempts succeeded or failed. For more information about validation retries, please refer to the Document Validation guide.
Use cases
The Flow execution view is particularly useful for:
Debugging failed processes
When a process fails, you can use the Flow execution view to:
- See exactly where in the flow the process stopped
- Review the inputs and outputs of the block where it failed
- Identify configuration issues or data problems
Understanding user behavior
By reviewing the execution path, you can:
- See which validation steps users typically complete
- Identify common failure points
- Optimize your flow based on actual usage patterns
Integration monitoring
For processes involving custom integrations:
- Verify that integrations are being called correctly
- Debug integration failures
- Validate request and response data
Validation analysis
For validation-heavy processes:
- Review retry patterns and success rates
- Understand why validations fail or succeed
- Analyze the effectiveness of retry configurations
- Identify validation steps that need optimization
Best practices
When using the Flow execution view:
- Review completed processes: Use this view to understand successful process executions and identify patterns.
- Debug failures: When troubleshooting, start by examining the block where the process failed or stopped.
- Check retries: For validation blocks, always review retry information to understand the full validation attempt history.
- Compare executions: Compare multiple process executions to identify common issues or patterns.
- Validate integrations: Regularly review custom integration blocks to ensure they’re working as expected.
Related guides
- Create a Web flow - Learn how to create web flows using the flowbuilder
- Create a WhatsApp flow - Learn how to create WhatsApp flows using the flowbuilder
- Guide to Get Results - Learn how to access and retrieve process results
- Customize your web flow - Configure flow behavior and appearance
- Document Validation - Learn about document validation and retry configurations